The Mindflex is marketed as a concentration game. It’s a toy that connects to a fan and moves a ball through an obstacle course. While wearing the Mindflex, the power of the fan relates to the power of one’s concentration.
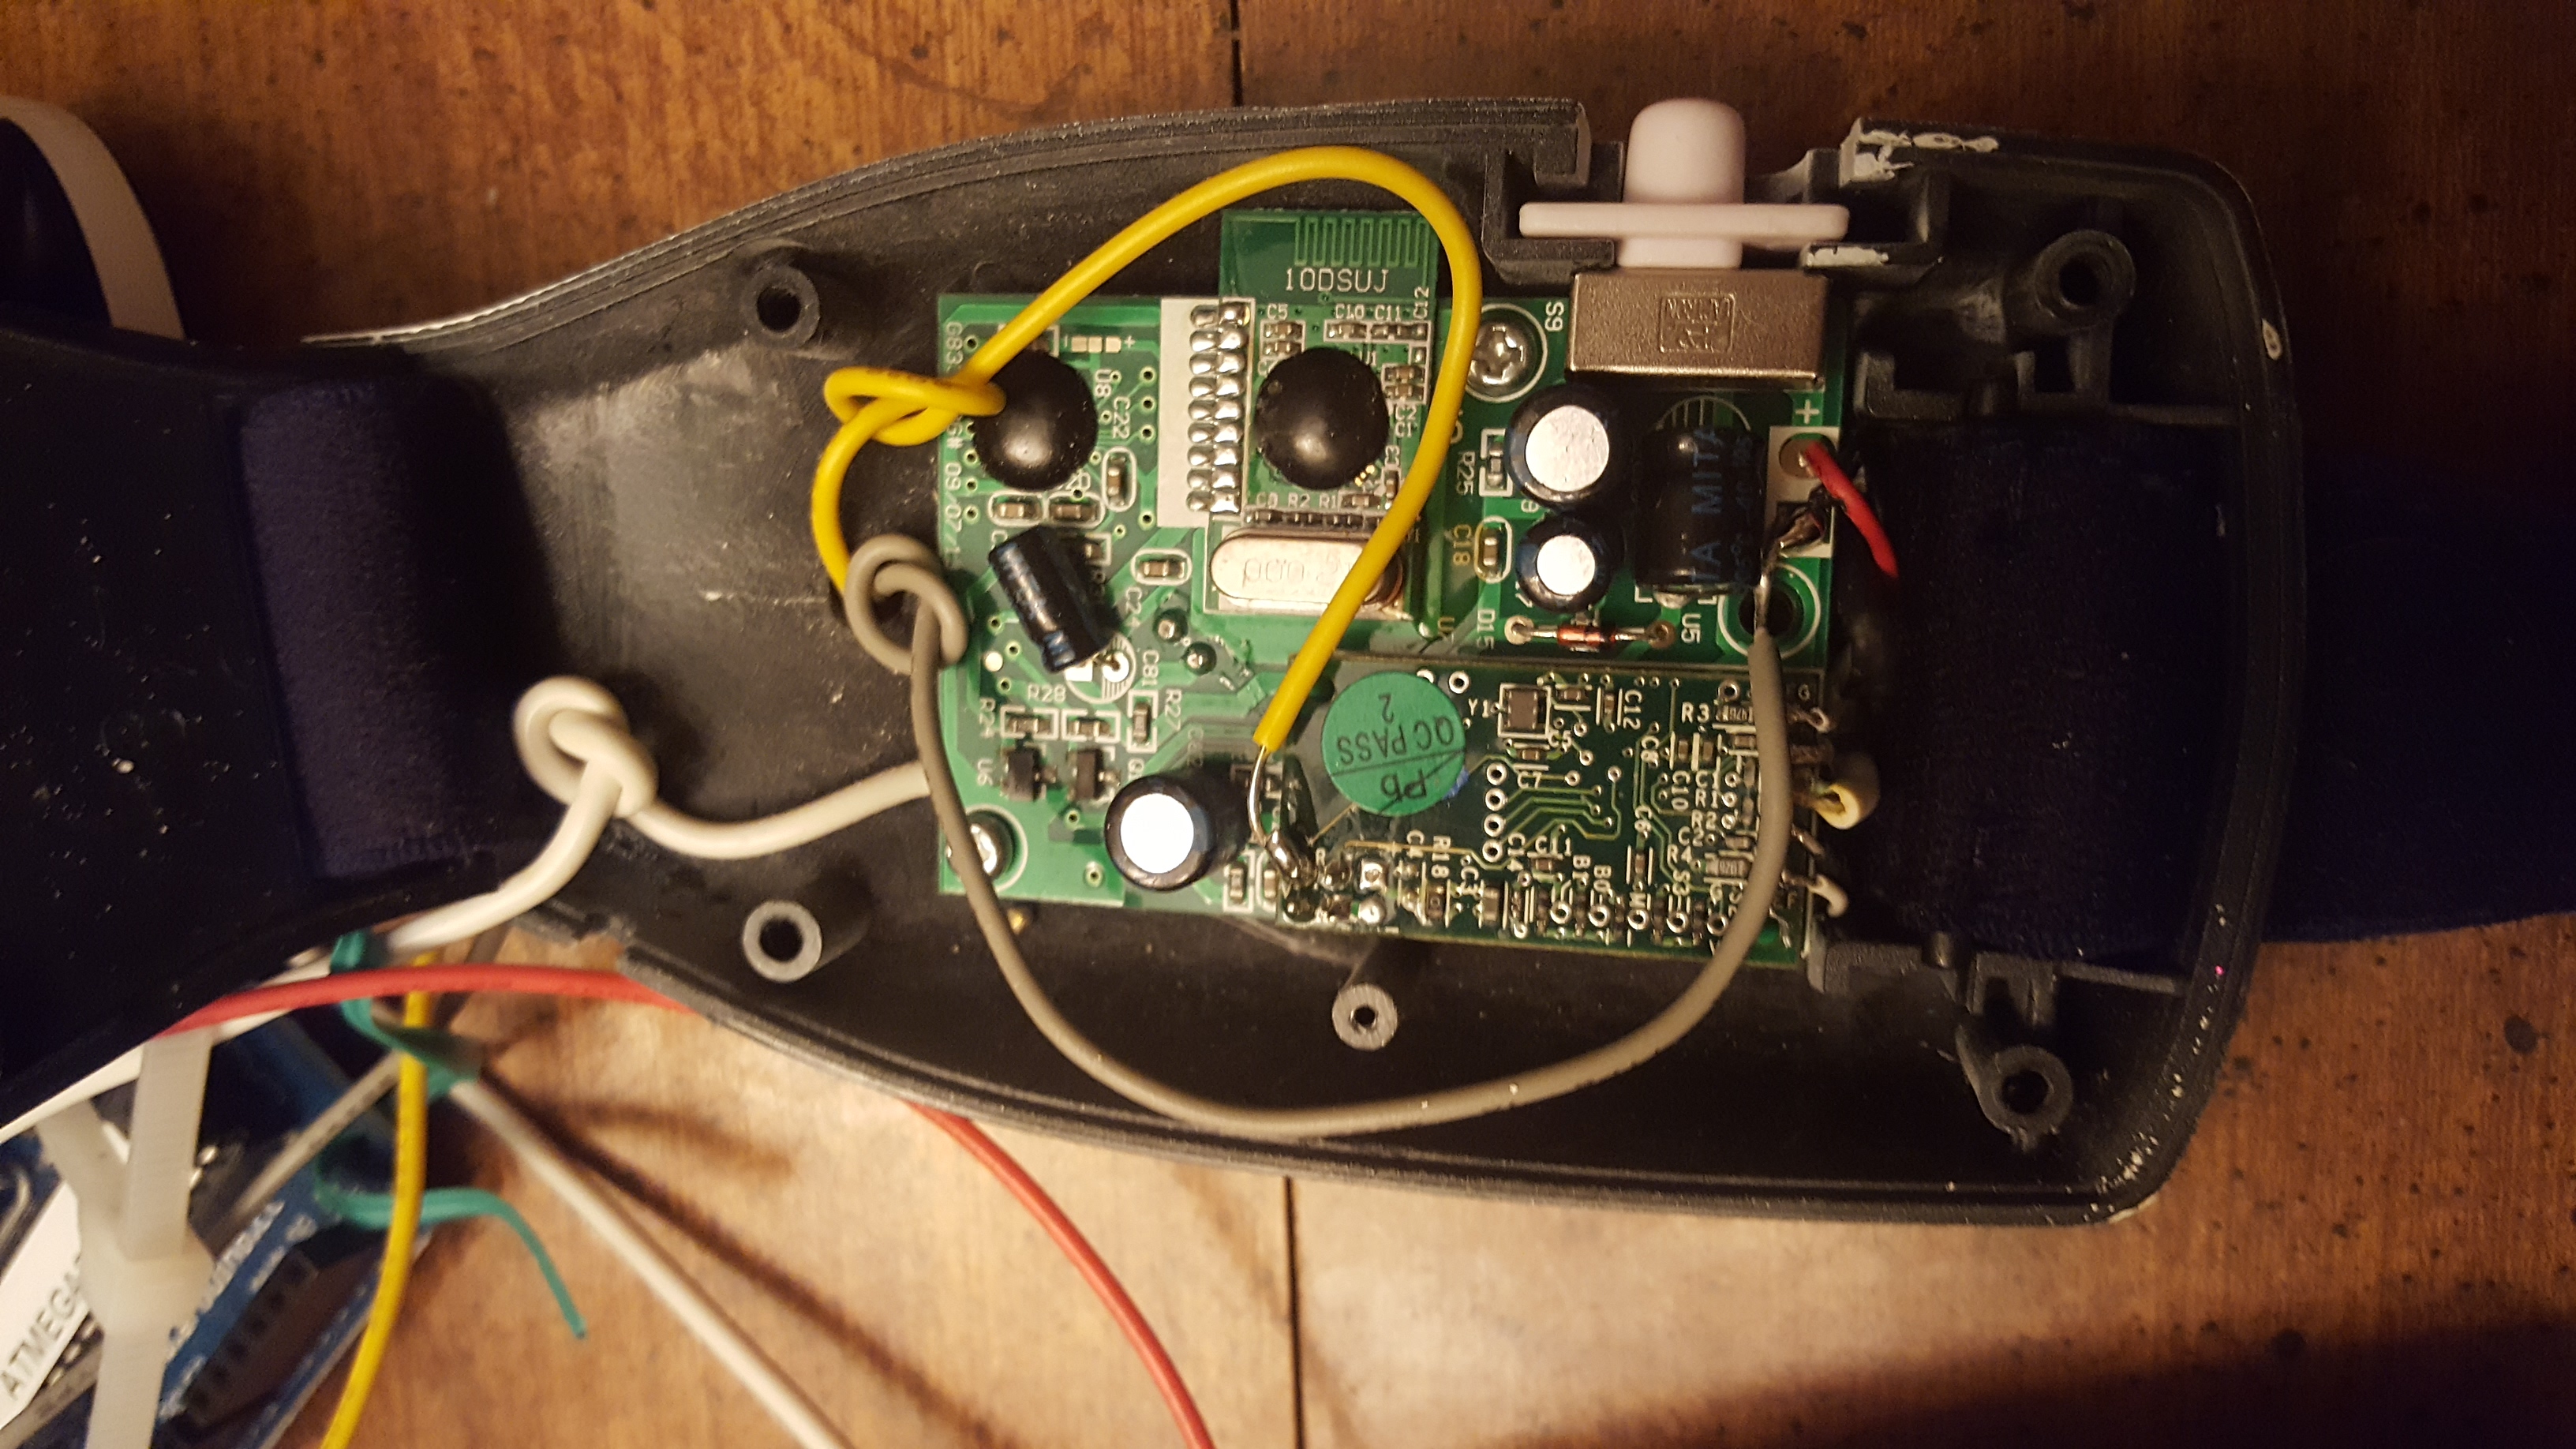
My friend Sterling and I changed the wiring to a USB connection in order to graph our brainwaves on a computer screen.

What the Mindflex Can Do
The Mindflex works by sensing a voltage difference across several metal contacts. When playing around with the MindFlex, one gets a sense of the intensity of concentration. It turns out the Mindflex sensors pick up 7 different brainwave frequencies, not just one. By hacking it, we got access to all these pieces of data.


There’s no limit to the sort of things could be controlled with the Mindflex once it’s hacked.
Troubleshooting
Before we managed to print these graphs, we ran into connection quality issues. The connection to the PC was affecting the Mindflex’s ability to sense a slight voltage difference in the brain. This was due to the PC being plugged into the wall outlet.
We fixed this problem by introducing a new component to the circuit, an Optoisolator, also known as an Optical Coupler.

The Optoisolator keeps the Mindflex and Arduino electrically isolated from each other. It does this by transferring data through an LED and a Photosensor instead of through a wire. Our connection quality improved greatly with this new addition.


We added LEDs for testing purposes as well as looking neat. We notice a worsened connection with red LEDs compared to green LEDs. Perhaps the voltage drop across certain LEDs interferes with the data transmission. A final product might want to exclude them.

Final Thoughts
For my first Arduino project, I’m happy with the results, but there’s a lot more the Mindflex could do. I would like to play an instrument controlled by one’s thoughts, or a video game that used the Mindflex as a controller. I also wonder if there’s any practical applications to these graphs. Would analyzing them help someone practice meditation? Perhaps a Psychology study could be designed around using the Mindflex.
Resources
Here’s the program we used for gathering the input data from the Mindflex to the Arudino: https://github.com/kitschpatrol/Brain
Here’s the program for displaying the inputs over time in a graph on the computer: https://github.com/kitschpatrol/BrainGrapher


No. I don’t believe you. small voltage?! r u kidding me?